Tableau TDS-C01 - Tableau Desktop Specialist Exam Certification Examination Exam
Question #1 (Topic: demo questions)
Which of the following would you use to connect to multiple tables in a single data source at once?
Correct Answer: D
Explanation:
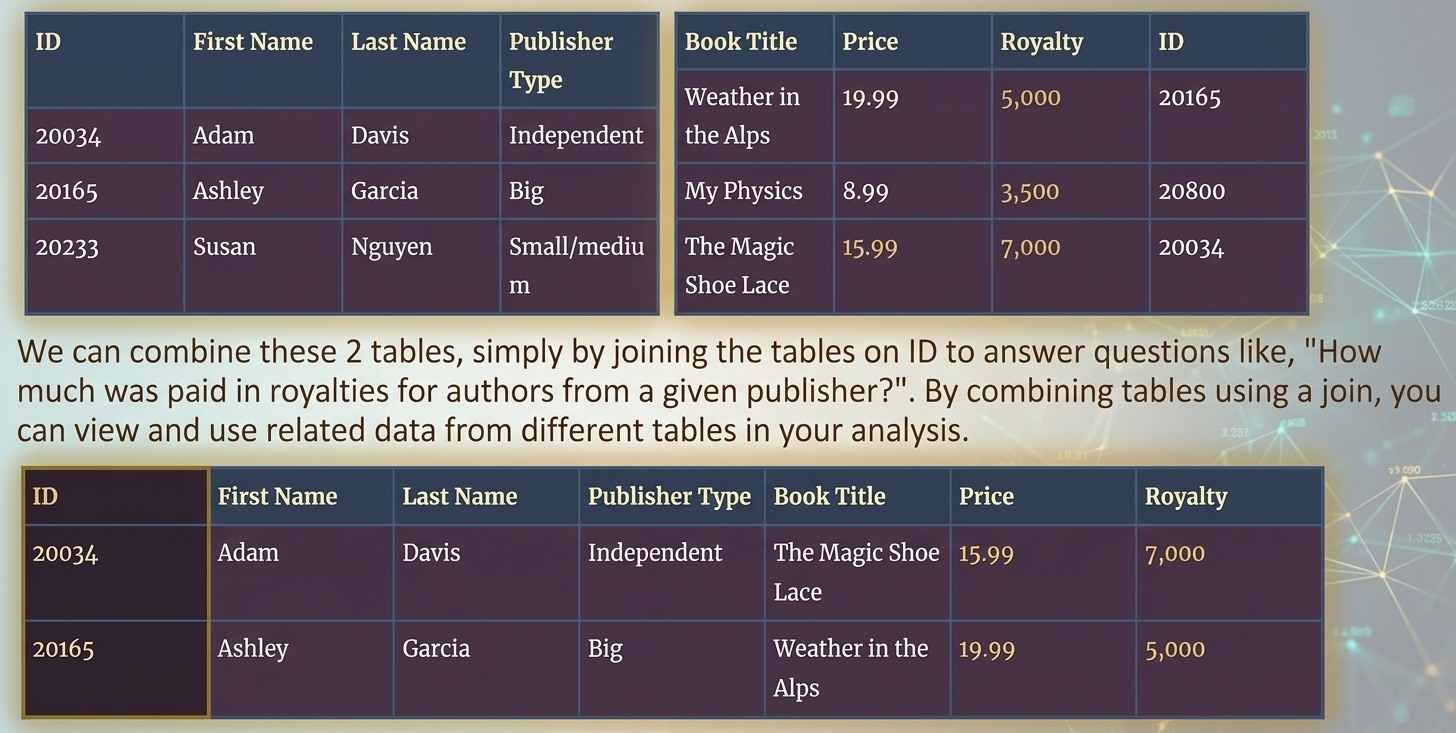
The data that you analyze in Tableau is often made up of a collection of tables that are related by
The data that you analyze in Tableau is often made up of a collection of tables that are related by
specific fields (that is, columns). Joining is a method for combining data on based on those common
fields. The result of combining data using a join is a virtual table that is typically extended
horizontally by adding columns of data.
For example, consider the following two tables originating from a single data source:
Question #2 (Topic: demo questions)
By definition, Tableau displays measures over time as a
Correct Answer: D
Explanation:
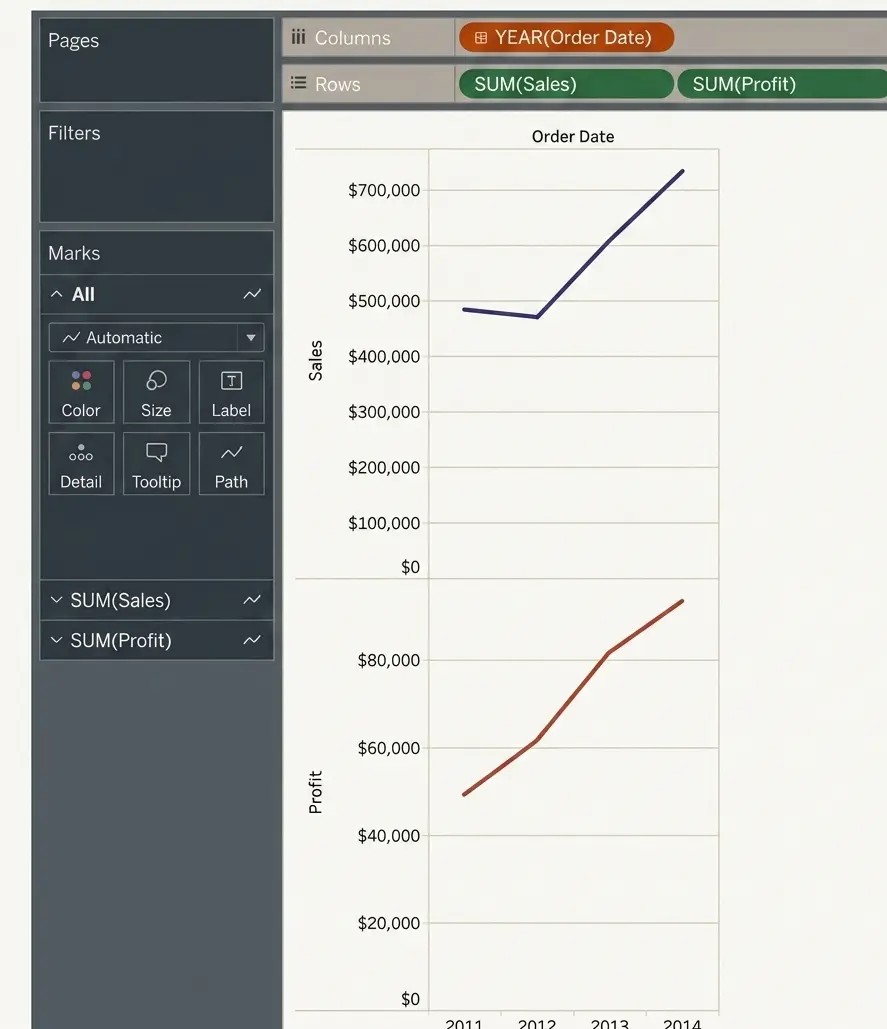
Line charts connect individual data points in a view. They provide a simple way to visualize a
Line charts connect individual data points in a view. They provide a simple way to visualize a
sequence of values and are useful when you want to see trends over time, or to forecast future
values.
Please refer to the images below:
Question #3 (Topic: demo questions)
Is it possible to use measures in the same view multiple times (e.g. SUM of the measure and AVG of
the measure)?
Correct Answer: A
Explanation:
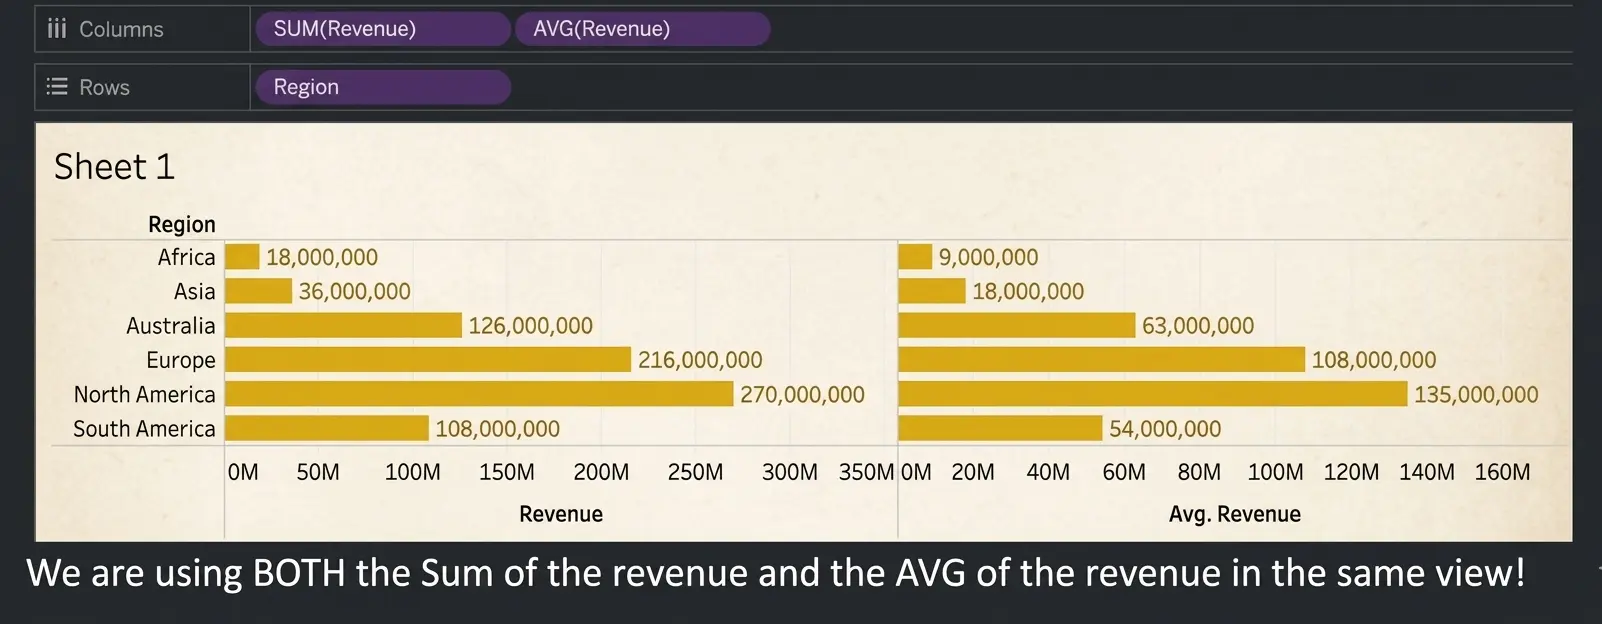
Yes, it is very much possible to use measures in the same view multiple times. For example, refer to
Yes, it is very much possible to use measures in the same view multiple times. For example, refer to
the image below:
Question #4 (Topic: demo questions)
True or False: The Highlighting action can be disabled for the entire workbook.
Correct Answer: A
Explanation:
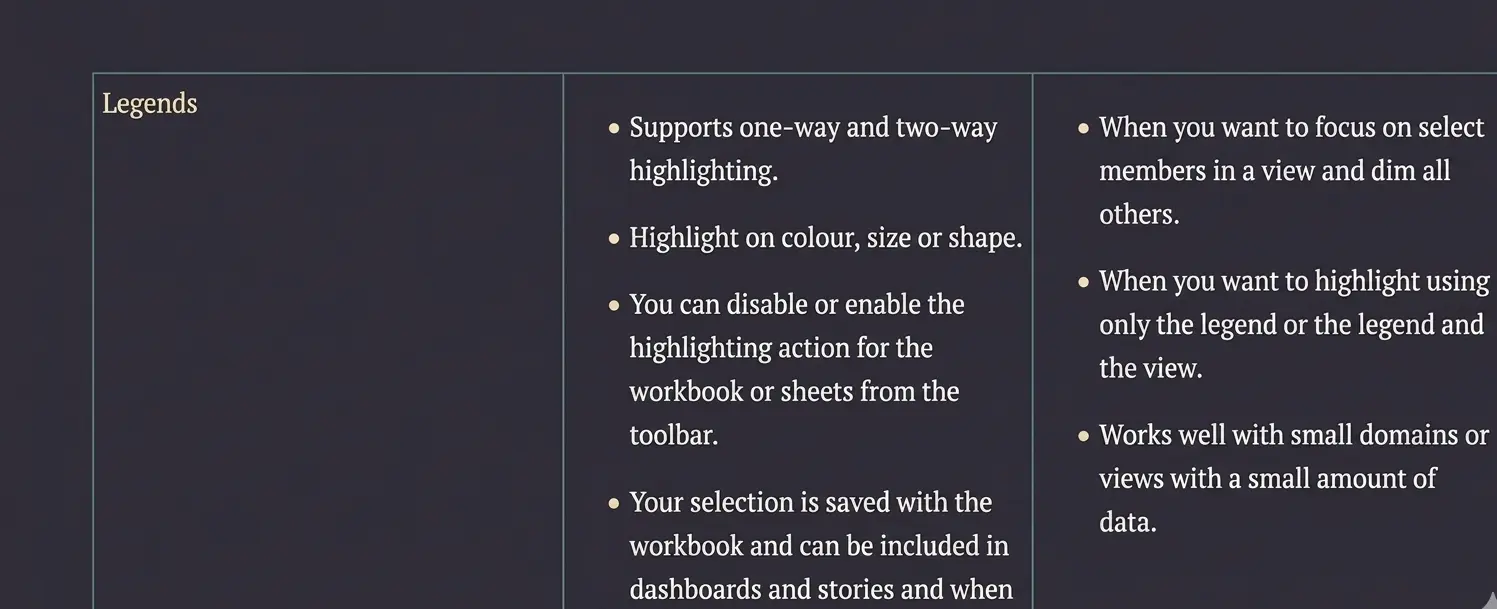
Yes, it is possible to disable highlighting for the entire workbook.