Tableau TDA-C01 - Tableau Certified Data Analyst Certification Examination Exam
Question #1 (Topic: demo questions)
A colleague provides you with access to a folder that contains the following files:
• Sates.csv • Bookl.twb • Sates.hyper • Export.mdb Which He contains an
extract?
Correct Answer: C
Explanation:
A .hyper file is an extract file that contains a snapshot of data from a data source. It is a compressed
A .hyper file is an extract file that contains a snapshot of data from a data source. It is a compressed
and optimized file format that can be used to improve the performance and portability of
dashboards and workbooks. A .twb file is a workbook file that contains the visualization and
connection information, but not the data itself. A .csv file is a comma-separated values file that
contains plain text data. A .mdb file is a Microsoft Access database file that contains tables, queries,
forms, and other objects. Reference: https://help.tableau.com/current/pro/desktop/enus/
save_savework_packagedworkbooks.htm https://help.tableau.com/current/pro/desktop/enus/
extracting_data.htm https://help.tableau.com/current/pro/desktop/en-us/examples_csv.htm
https://support.microsoft.com/en-us/office/introduction-to-access-database-files-9f9a0f8c-9a3c-
4a0b-8e6c-6d1f1f7c2b7e
Question #2 (Topic: demo questions)
You publish a dashboard tut uses an attract. The extract refreshes every Monday at 10:00.
You need to ensure that the extract also refreshes on the last day of the month at 18:00.
What should you do?
Correct Answer: B
Explanation:
To refresh an extract on Tableau Server, you need to select the workbook, select Refresh Extracts, and
To refresh an extract on Tableau Server, you need to select the workbook, select Refresh Extracts, and
then add a new extract refresh. You can specify the frequency and time of the refresh, as well as any
custom options. You can have multiple extract refreshes for the same workbook with different
schedules. Reference: https://help.tableau.com/current/server/en-us/refresh_extracts.htm
https://help.tableau.com/current/server/en-us/refresh_extracts_add.htm
Question #3 (Topic: demo questions)
You want to show only visualization at time. Users must be able to switch between visualizations.
What should you me?
Correct Answer: C
Explanation:
Showhide buttons are a feature that allows you to show or hide a layout container on a dashboard.
Showhide buttons are a feature that allows you to show or hide a layout container on a dashboard.
You can use showhide buttons to create a toggle effect that switches between two visualizations. You
need to place each visualization in a separate layout container and then add a showhide button for
each container. You can customize the appearance and behavior of the buttons to suit your needs.
Reference: https://help.tableau.com/current/pro/desktop/enus/
dashboards_organize_floating_layoutcontainers.htm
https://help.tableau.com/current/pro/desktop/en-us/dashboards_showhide.htm
Question #4 (Topic: demo questions)
You have the following box plot that shows the distribution of average profits made in every state by
region.
Which region has the smallest distribution of profits?
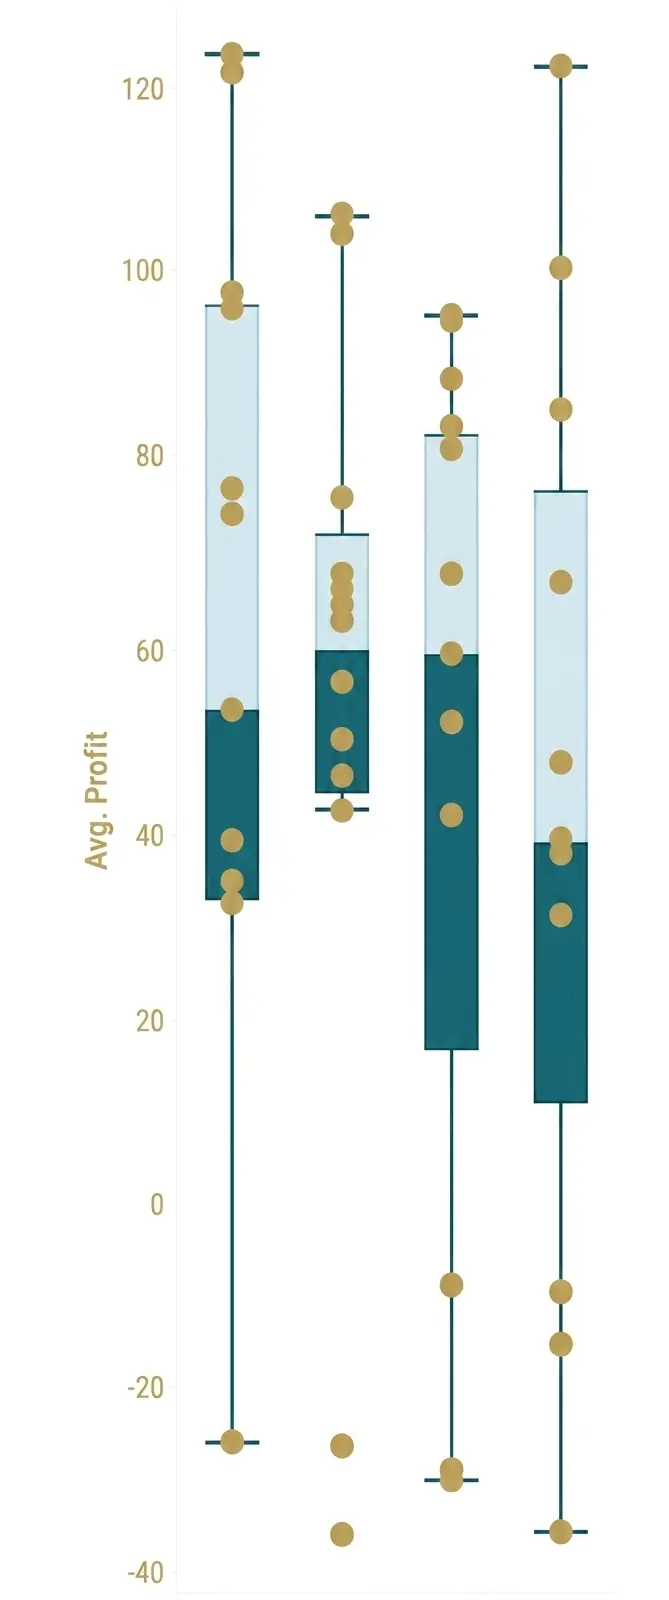
Correct Answer: C
Explanation:
The central region has the smallest distribution of profits because it has the smallest interquartile\