Tableau Desktop-Specialist - Tableau Desktop Specialist Certification Examination Exam
Question #1 (Topic: demo questions)
Which of the following would you use to connect to multiple tables in a single data source at once?
Correct Answer: D
Explanation:
The data that you analyze in Tableau is often made up of a collection of tables that are related by
The data that you analyze in Tableau is often made up of a collection of tables that are related by
specific fields (that is, columns). Joining is a method for combining data on based on those common
fields. The result of combining data using a join is a virtual table that is typically extended
horizontally by adding columns of data.
For example, consider the following two tables originating from a single data source: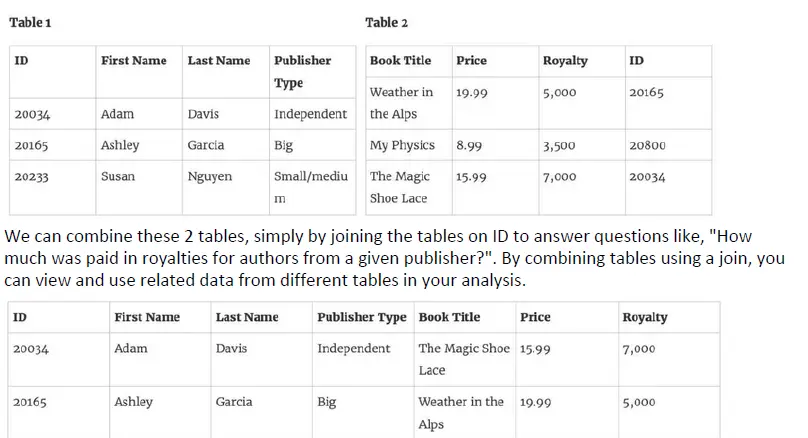
Question #2 (Topic: demo questions)
By definition, Tableau displays measures over time as aa
Correct Answer: D
Explanation:
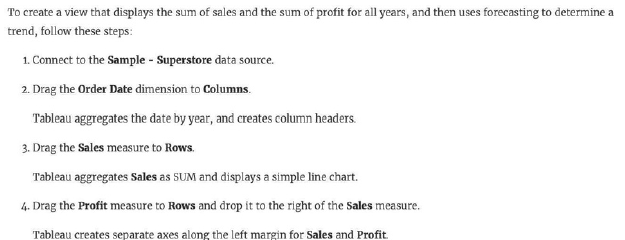
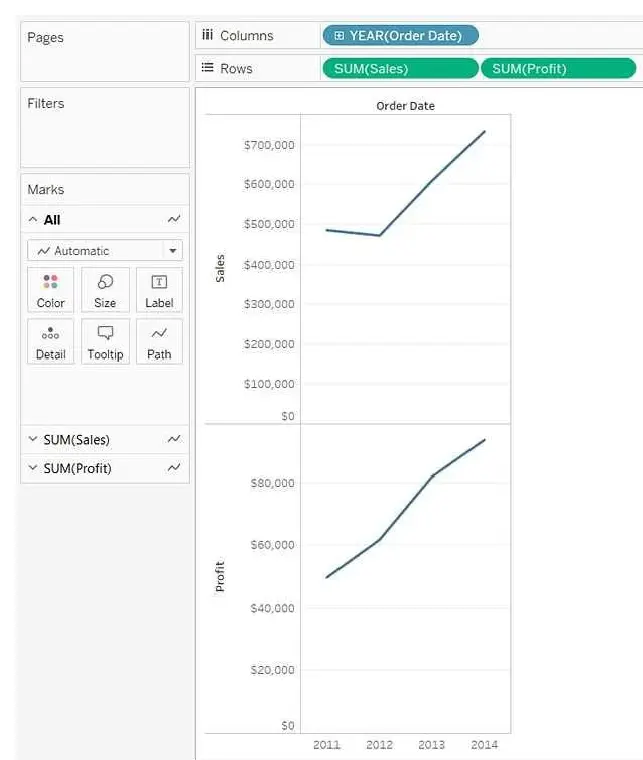
Line charts connect individual data points in a view. They provide a simple way to visualize a
Line charts connect individual data points in a view. They provide a simple way to visualize a
sequence of values and are useful when you want to see trends over time, or to forecast future
values.
Please refer to the images below:
Question #3 (Topic: demo questions)
True or False: The Highlighting action can be disabled for the entire workbook.
Correct Answer: A
Explanation:
Yes, it is possible to disable highlighting for the entire workbook.
Question #4 (Topic: demo questions)
Is it possible to use measures in the same view multiple times (e.g. SUM of the measure and AVG of
the measure)?
Correct Answer: A
Explanation:
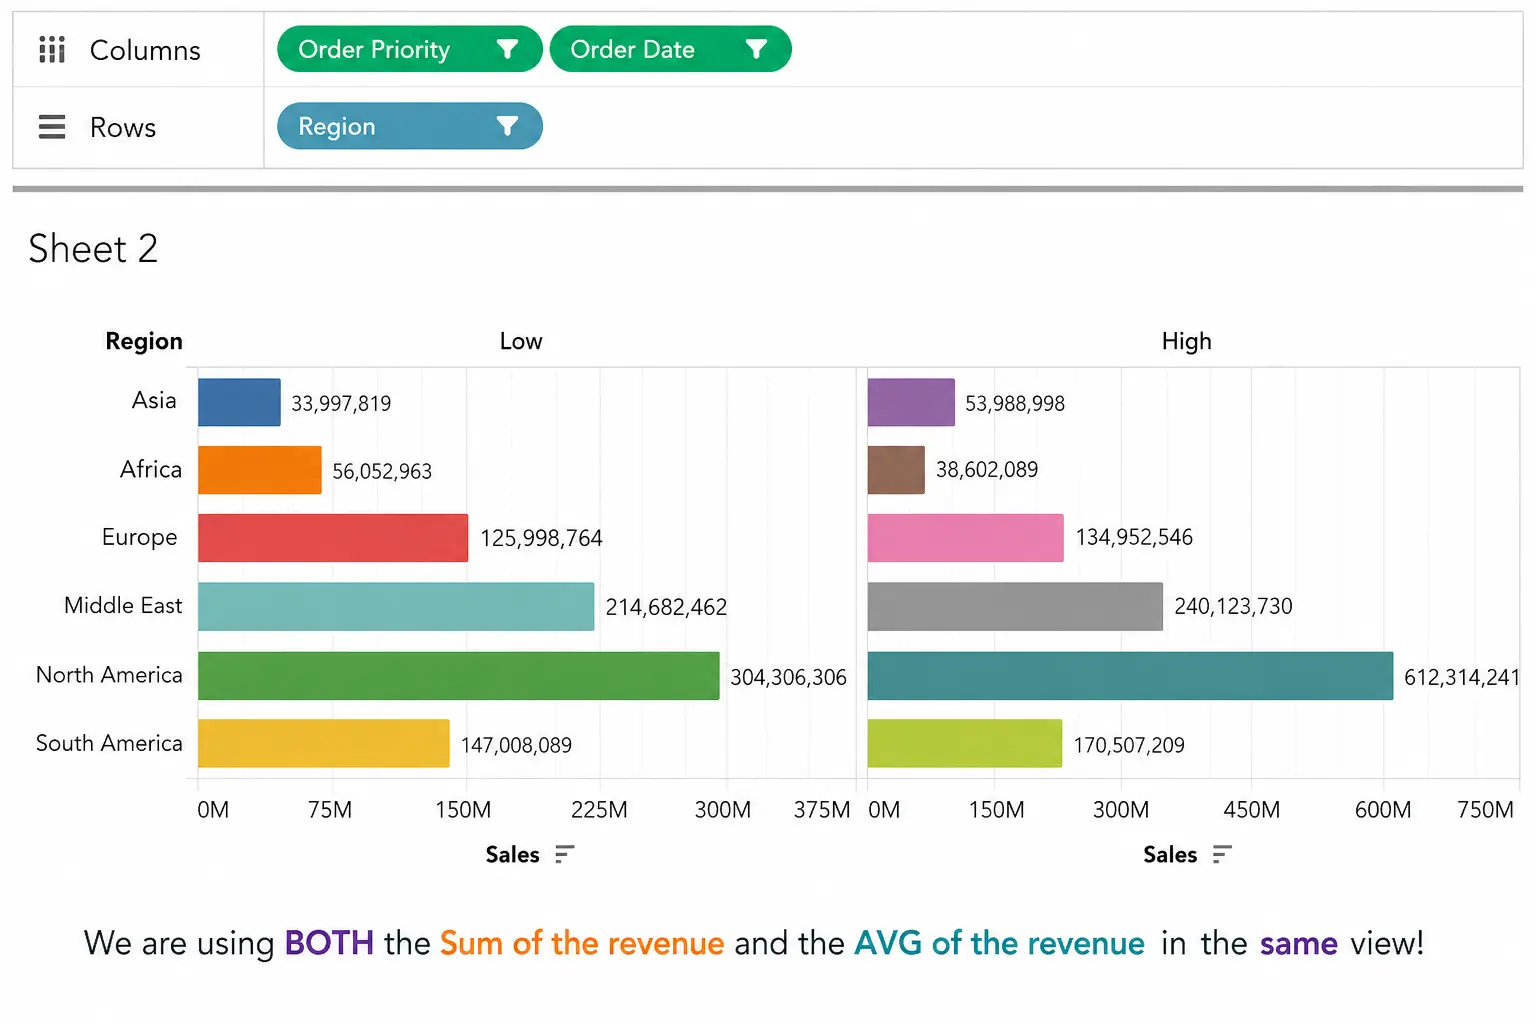
We are using BOTH the Sum of the revenue and the AVG of the revenue in the same view!
Question #5 (Topic: demo questions)
True or False : Bins can be created on dimensions
Correct Answer: B
Explanation:
Bin are a user-defined grouping of numerical data in the data source.