Salesforce Analytics-DA-201 - Salesforce Certified Tableau Data Analyst Certification Examination Exam
Question #1 (Topic: demo questions)
A colleague provides you with access to a folder that contains the following files: • Sates.csv • Bookl.twb • Sates.hyper • Export.mdb Which He contains an extract?
Correct Answer: C
Explanation:
A .hyper file is an extract file that contains a snapshot of data from a data source. It is a compressed and optimized file format that can be used to improve the performance and portability of dashboards and workbooks. A .twb file is a workbook file that contains the visualization and connection information, but not the data itself. A .csv file is a comma-separated values file that contains plain text data. A .mdb file is a Microsoft Access database file that contains tables, queries, forms, and other objects. Reference: https://help.tableau.com/current/pro/desktop/enus/save_savework_packagedworkbooks.htm https://help.tableau.com/current/pro/desktop/enus/extracting_data.htm https://help.tableau.com/current/pro/desktop/en-us/examples_csv.htm https://support.microsoft.com/en-us/office/introduction-to-access-database-files-9f9a0f8c-9a3c4a0b-8e6c-6d1f1f7c2b7e In Tableau, a .hyper file is an extract file created by the Hyper database engine. It contains a snapshot of the data pulled into Tableau and is used to perform data analysis without the need for a live connection to the data source.
Question #2 (Topic: demo questions)
You publish a dashboard tut uses an attract. The extract refreshes every Monday at 10:00. You need to ensure that the extract also refreshes on the last day of the month at 18:00. What should you do?
Correct Answer: B
Explanation:
To refresh an extract on Tableau Server, you need to select the workbook,select Refresh Extracts, and then add a new extract refresh. You can specify the frequency and time of the refresh, as well as any custom options. You can have multiple extract refreshes for the same workbook with different schedules. Reference: https://help.tableau.com/current/server/en-us/refresh_extracts.htm https://help.tableau.com/current/server/en-us/refresh_extracts_add.htm On Tableau Server, you can manage the scheduling of extract refreshes by selecting the specific workbook and configuring additional refresh schedules as needed. This allows for multiple refresh triggers, such as the regular Monday at 10:00 AM schedule, as well as an additional trigger for the last day of the month at 18:00.
Question #3 (Topic: demo questions)
You have the following dashboard.
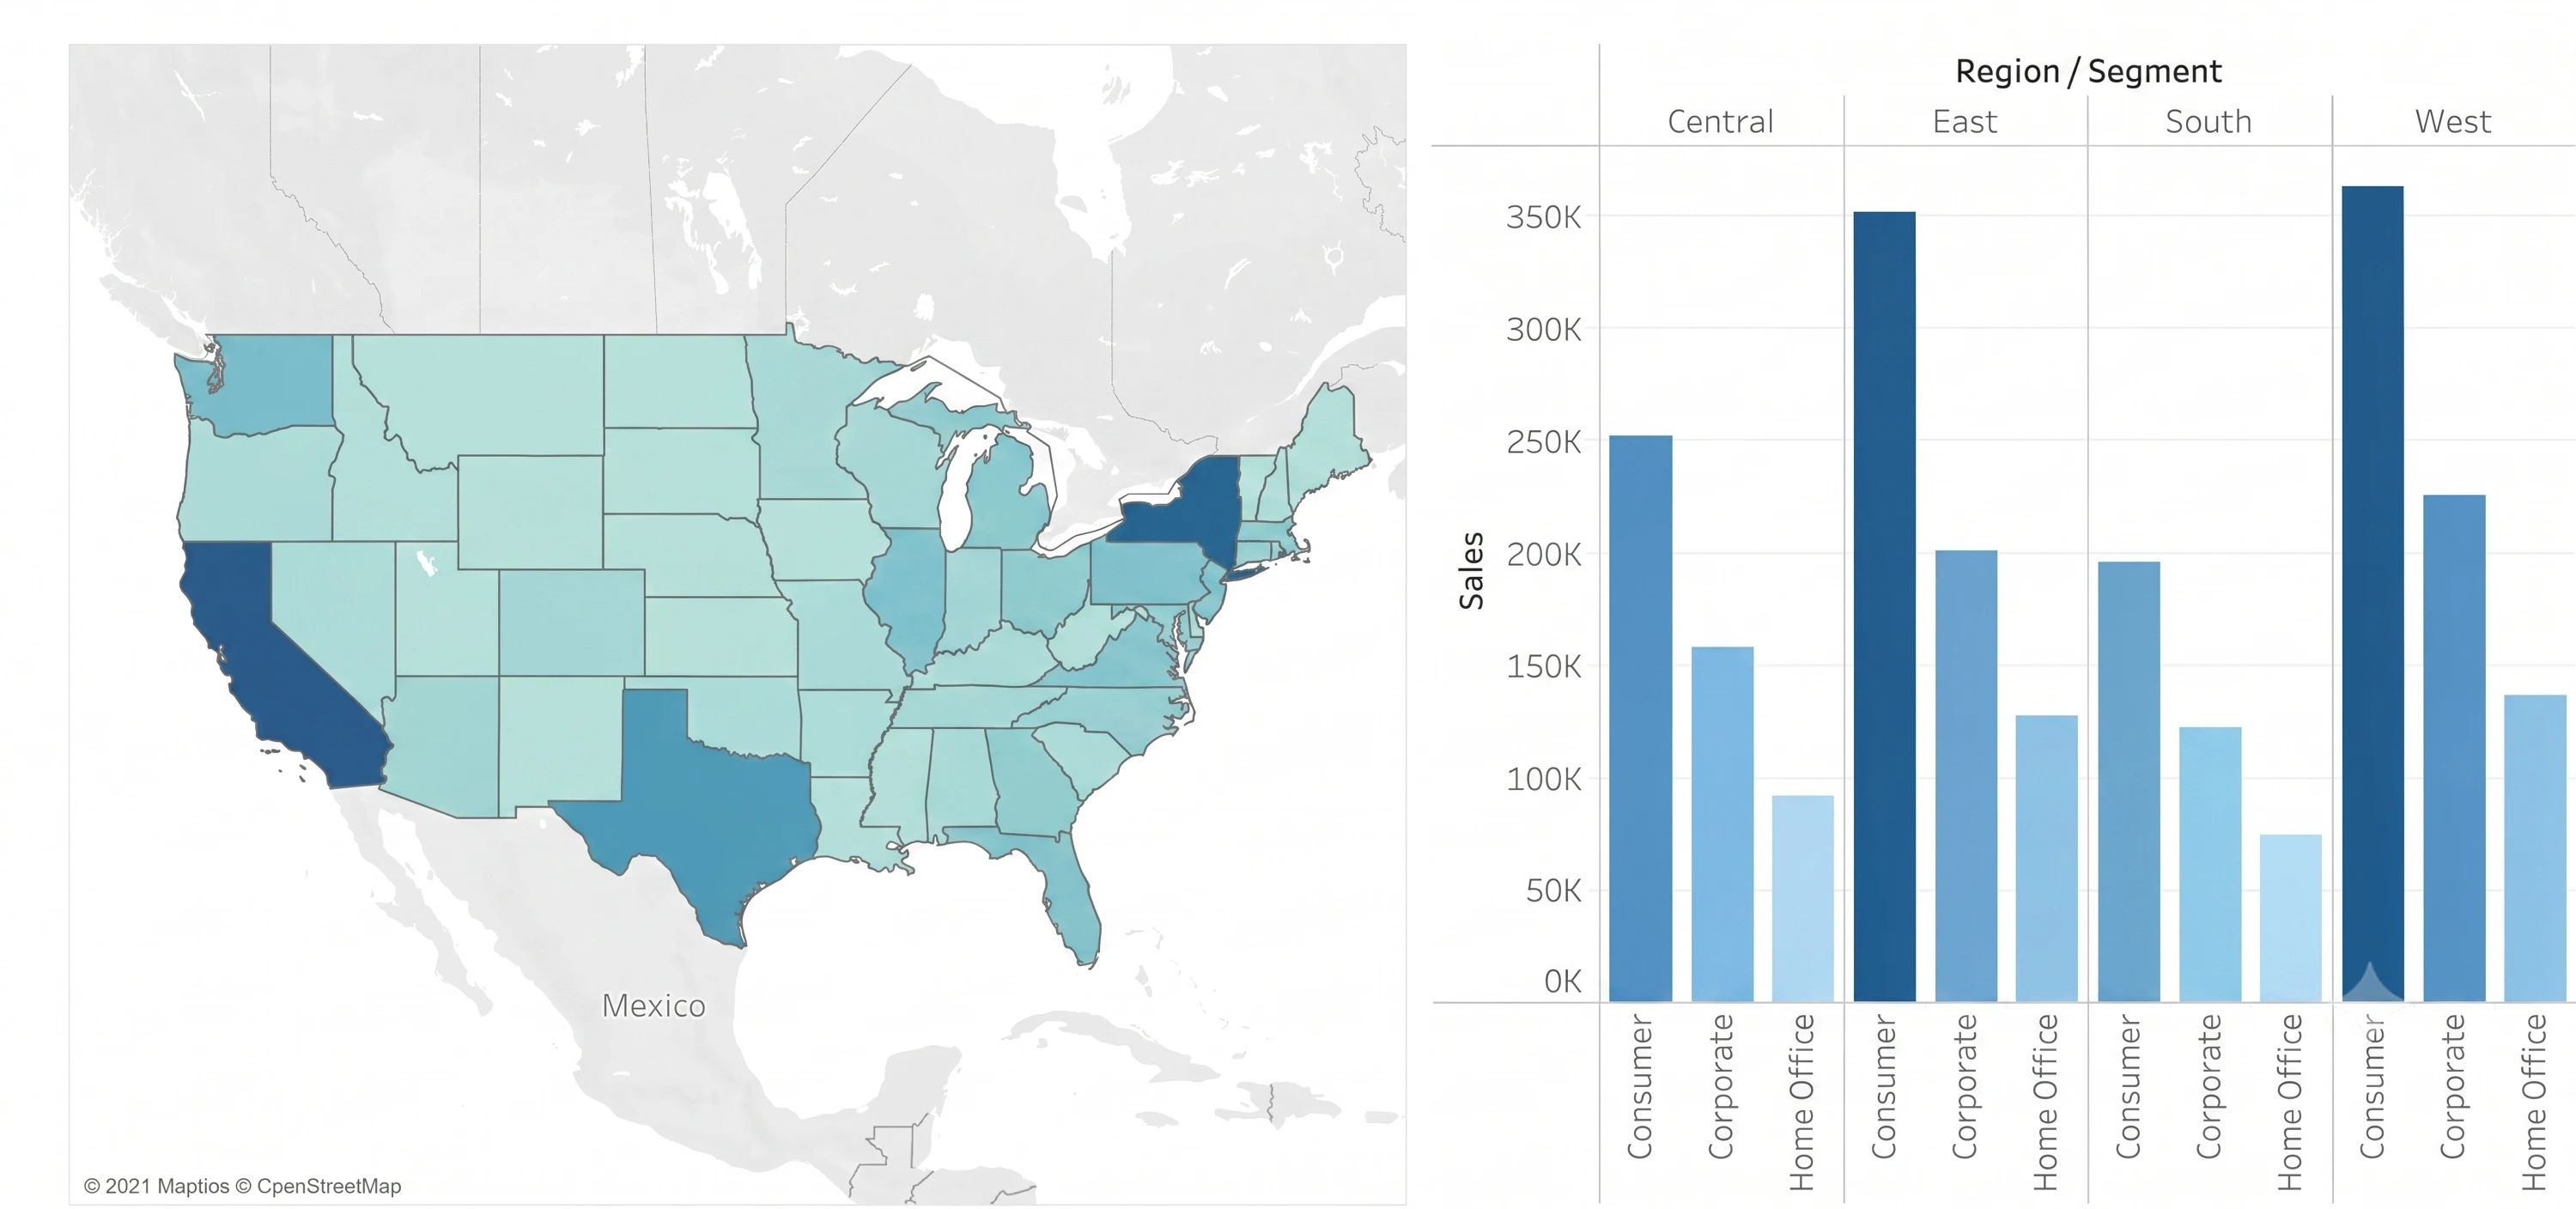
You want to show only one visualization at time. Users must be able to switch between visualizations. Whatshould you me?
Correct Answer: C
Explanation:
In Tableau, you can manage the visibility of different visualizations on a dashboard using various techniques. Among the options provided, the moststraightforward method to allow usersto switch between two visualizations is to use show/hide buttons. Here's why each option is or isn’t suitable for the requirement: A . A parameter and a calculated field: While it's possible to use a parameter and a calculated field to control which visualization is displayed, it requires creating a calculated field that responds to a parameter and then using that field to filter the view. This method can become complex and is not as user-friendly for simply showing and hiding visualizations. B . Worksheet actions: Worksheet actions in Tableau typically allow users to interact with the data within a visualization, such as filtering data or highlighting related data points when clicking or hovering. They are not designed to control the visibility of entire visualizations on a dashboard. C . Show/hide buttons: Show/hide buttons are a feature specifically designed to manage the visibility of dashboard elements. When you create a show/hide button, it can be configured to display or hide a particular visualization, container, or any other dashboard element when clicked. This provides a very intuitive interface for users to switch between visualizations. D . Dashboard actions: Dashboard actions, like worksheet actions, are used to create interactions between sheets, such as filtering data or navigating to other sheets or URLs based on user interactions. They are not intended for toggling the visibility of visualizations. Therefore, the correct answer is C. Show/hide buttons as they provide a user-friendly way to switch between visualizations on a dashboard without the need for complex calculations or actions that aren't meant for this purpose. The show/hide button feature is specifically designed for toggling visibility and offers a simple and effective solution for the requirement.
Question #4 (Topic: demo questions)
You have the following box plot thatshows the distribution of average profits made in every state by
region.
Which region hasthe smallest distribution of profits?
Correct Answer: A
Explanation: